

Kibi has a concept of external datasources which can be used in a variety of ways.
A datasource can be a SQL database, a SPARQL endpoint, or a REST endpoint. After writing a query over a datasource, you can display its results in a visualization or use them as a filter with the special aggregator called “external datasource“.
For example, would you like to show only the traffic on your website by users “Who have purchased more than 1000$ of stuff in the last 2 months?” — very easy with the Kibi SQL datasource, a proper SQL query defined in Kibi “Queries” Tab and a visualization created using the “external datasource” query.
In this post, however, we describe how to use an Elasticsearch index as a REST datasource. This way, we can write any Elasticsearch query that may not yet be possible through the Kibi/Kibi interface and use its results in a filter or in a special visualization.
For example, a very common request for Kibana is to be able to “show the latest/current value” from a timeseries. This is not currently possible, so while we wait for Kibana 5+ to possibly support this, let’s see how we can do this by invoking Elasticsearch itself as a Kibi REST Datasources.
Download Kibi v0.2 here and start with the tutorial! (and of course.. you can learn more about external datasources here.)
Configuration of Kibi
Before starting Kibi, we need to adjust the default configuration of external datasources. By default, the results are cached for a period of time. Since we want to fire the same query multiple time, we need to either disable the cache, or reduce the maximum age of an object in the cache. Let’s do the former.
Edit the configuration file at “config/kibi.yml” and search for the entry “datasource_enable_cache”. Set its value to “false”.
Finally, start your elasticsearch cluster and the Kibi application.
Create an Index
We will create an index per day, to show the use of index patterns.
Execute the following command to create the “metrics” template for indices matching the pattern “metrics-*”:
curl -XPUT 'http://localhost:9200/_template/metrics' -d '
{
  "template": "metrics-*",
  "mappings": {
    "weather": {
      "properties": {
        "time": {
          "type": "date",
          "format": "date"
        }
      }
    }
  }
}
'
Create a first index “metrics-2016-01-25”:
curl -XPUT 'http://localhost:9200/metrics-2016-01-25/weather/1' -d '
{
  "location": "Ireland",
  "time": "2016-01-25",
  "conditions": [ "rain", "sunny" ]
}
'
This index provides weather conditions in Ireland for each day. This is an accurate record of that day!
Finally, add the index pattern “metrics-*” to Kibi in the settings page.
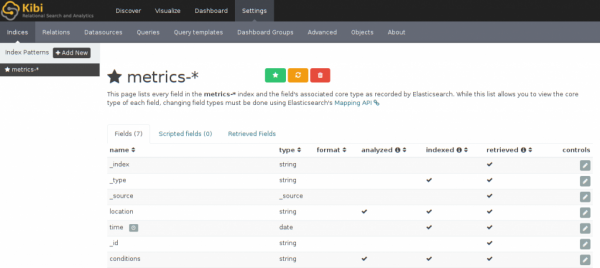
Metrics indices
Create a REST datasource
In Kibi you can use the REST datasource to communicate with an Elasticsearch index. In this tutorial, it will be the same as the one powering Kibi.
Go to the “Datasources” tab in the settings page in order to create a new datasource. There, fill out the following fields:
- Title: Metrics Elasticsearch indices
- Type: REST
- url: http://localhost:9200/metrics-*/_search
Hit the save button ![]() .
.
Create a Query on the ES Datasource
In the “Queries” tab of the settings page, you can write a query against a datasource.
We write in this tutorial a query on ES to retrieve the latest value of the field “conditions”. To do so, fill out the following fields of the “Queries” page:
- Title: last weather conditions
- Method: POST
- Body: the Elasticsearch query that orders document on the “time” field and retrieves the fields “time” and “conditions”
{
  "size": 1,
  "fields": ["time", "conditions"],
  "sort": [
    {
      "time": {
        "order": "desc"
      }
    }
  ]
}
When hitting the save button ![]() , you will see on the right side of the page the results of the query.
, you will see on the right side of the page the results of the query.
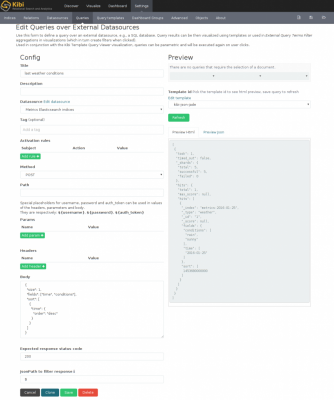
REST query editor
Create a Query Template
Query Templates in Kibi turn query results into something that can be visualized.
In the previous image, we use the default Kibi-provided “kibi-json-jade” template which is fine for testing a query. But once the query is finalized, you want something prettier for the end user!
We will use the Jade template engine for writing our query. We will show the date of the record, and display in a list the weather conditions for the day. The final goal is to have the following pretty end-result:

To do this:
- Set “weather template” as the title for the template
- Select “jade” as the engine
- Copy the template below:
span !{results[0].hits.hits[0].fields.time}
br
span !{results[0].hits.hits[0].fields.conditions}
After saving the template, you can check the output by selecting a query to use on the right side.
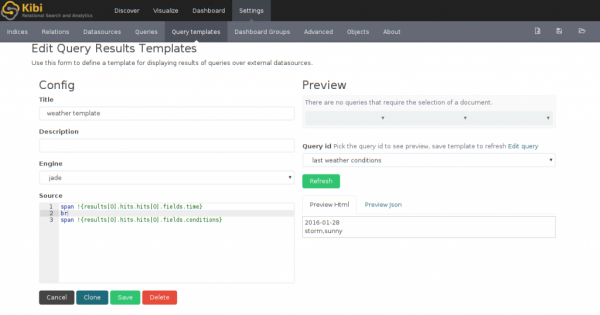
Query template editor
Showing the template in a dashboard
The Templated Query Viewer allows to create a visualization with the output of a template run on a set of queries.
Go the to the “Visualize” tab and create such a new visualization. Select the following items in the menu:
- Source query: last weather conditions
- Template: weather template
Test the visualization by clicking on the green button ![]() . Now save it and name it “Last Weather Conditions”.
. Now save it and name it “Last Weather Conditions”.
Profit
It’s time to create a dashboard and add the freshly created “last weather conditions” visualization to it. This will display the result of the ES query that retrieved the latest value of the “conditions” field of our “weather” index. Save the dashboard with the name “Ireland“.
Click on the time menu on the top right to set a refresh rate, e.g., 10s.
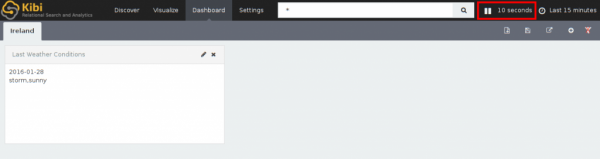
Dashboard with the templated query viewer visualisation
Now execute the following commands, one after the other, to add new documents.
You will see that only the latest weather conditions are displayed.
curl -XPUT 'http://localhost:9200/metrics-2016-01-26/weather/2' -d '
{
  "location": "Ireland",
  "time": "2016-01-26",
  "conditions": [ "rain", "cloudy" ]
}
'
curl -XPUT 'http://localhost:9200/metrics-2016-01-27/weather/3' -d '
{
  "location": "Ireland",
  "time": "2016-01-27",
  "conditions": [ "rain", "hail", "wind" ]
}
'
curl -XPUT 'http://localhost:9200/metrics-2016-01-28/weather/4' -d '
{
  "location": "Ireland",
  "time": "2016-01-28",
  "conditions": [ "storm", "sunny" ]
}
'
Cool? Don’t forget to subscribe to our mailing list below for a lot of great Kibi/Kibana releases expected in 2016.
Also published on Medium.


